GeoWealth's Market Observations
INSIGHTS FROM OUR INVESTMENT SOLUTIONS TEAM
Q2 2026's Key Themes:
June 30, 2026- Equities: Markets advanced in Q2 as earnings and AI-related spending remained supportive, though leadership stayed narrow and increasingly concentrated in semiconductors, memory, and other companies tied to the AI buildout.
- Fixed Income: Bonds stabilized in Q2, but the policy backdrop grew less comfortable as the June Fed meeting reinforced a firmer inflation focus under new Chair Kevin Warsh. Markets moved to price a more hawkish path, while the ECB also raised rates and signaled that energy-driven inflation pressures were beginning to broaden, leaving fixed income supported by income but still sensitive to policy and inflation surprises.
- Broader Markets: Some of the year’s most crowded inflation and debasement trades reversed in Q2, with commodities, oil, and gold pulling back as oil-shock fears eased and the dollar firmed. The move suggested a rotation away from first-quarter hedges and back toward growth-sensitive and AI-linked assets, even as macro risks remained in view.
Market Total Returns as of 06/30/26: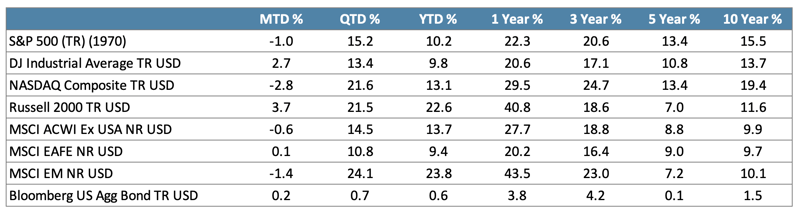
Source: Morningstar.1
U.S. Equities - Strong Returns, Narrow Leadership
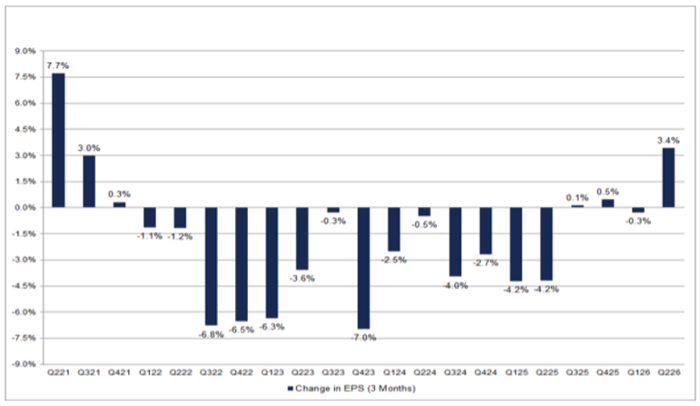
U.S. equities rebounded sharply in the second quarter as strong earnings, resilient economic data, and continued enthusiasm around AI-related spending helped markets recover from the first-quarter drawdown. The S&P 500 gained 15.2% in Q2 and finished the first half up 10.2%, while the Nasdaq Composite rose 21.6% in the quarter and 13.1% year to date. The Dow Jones Industrial Average gained 13.4% in Q2 and 9.8% year to date, while small caps also participated, with the Russell 2000 rising 21.5% in the quarter and 22.6% year to date. The rally was supported by improving earnings expectations, with FactSet reporting that Q2 S&P 500 bottom-up EPS estimates increased 3.4% during the quarter, the largest quarterly increase since Q2 2021, while the index is expected to report year-over-year earnings growth of 23.3% for Q2.
S&P 500: Change in Quarterly Bottom-Up EPS (3 months)
Source: FactSet
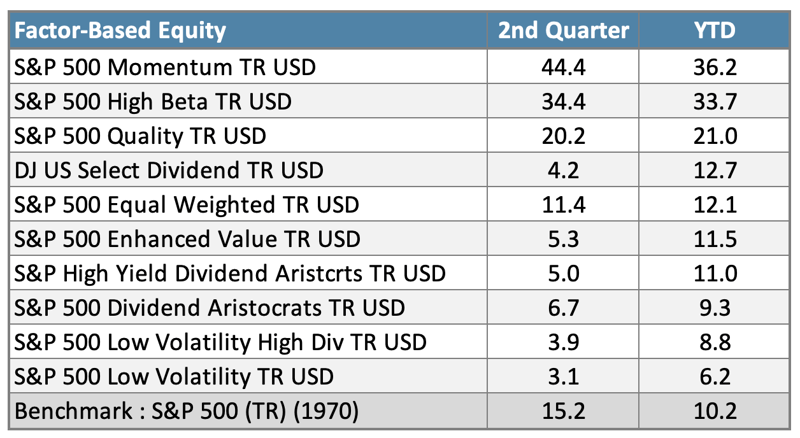
Sector leadership shifted meaningfully from the first quarter, with Technology reclaiming market leadership while Energy gave back some of its earlier gains. Technology rose 43.5% in Q2 and 32.7% year to date, far outpacing the broader market, while Industrials gained 14.9% in the quarter and 20.2% year to date. By contrast, Energy declined 12.5% in Q2 after its strong first-quarter rally, though it remained up 20.6% year to date, while Communication Services fell 3.0% in the quarter and remained down 8.3% year to date. Factor performance also reinforced the strength of the risk-on rotation: S&P Dow Jones Indices reported that Momentum returned 44.4% in Q2 and 36.2% year to date, while High Beta gained 34.4% in Q2 and 33.7% year to date. At the same time, Equal Weight returned 11.4% in Q2 and 12.1% year to date, suggesting participation improved beneath the surface even as leadership remained heavily tied to AI and technology-oriented exposures.
S&P 500: Sector Returns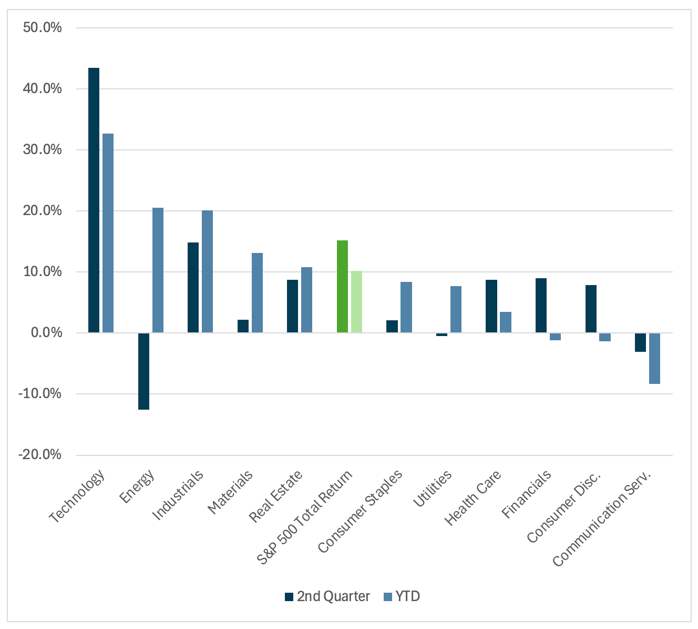
Source: Morningstar.1
Source: Morningstar.1
Beneath the headline rally, size and style leadership also shifted meaningfully. Small caps were among the strongest areas of the U.S. equity market, with the Russell 2000 gaining 21.5% in Q2 and 22.6% year to date, outpacing the S&P 500 through the first half. The move was especially notable in June, when small caps rose more than 4%, helping produce their strongest first half in more than 25 years. Broader participation also extended beyond small caps, with mid-caps, emerging-market equities, and the equal-weighted S&P 500 all outpacing the market-cap-weighted S&P 500 year to date.
Record First Half for Small Caps
Strongest 1H return in more than 25 years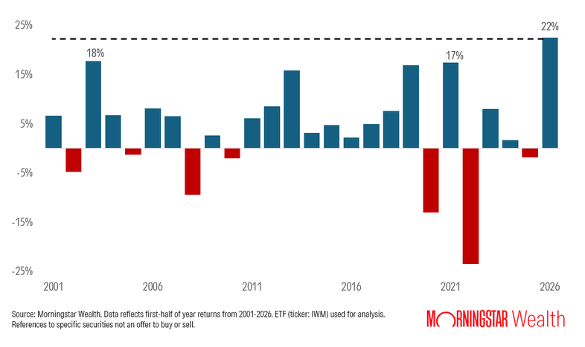
Source: Morningstar.1
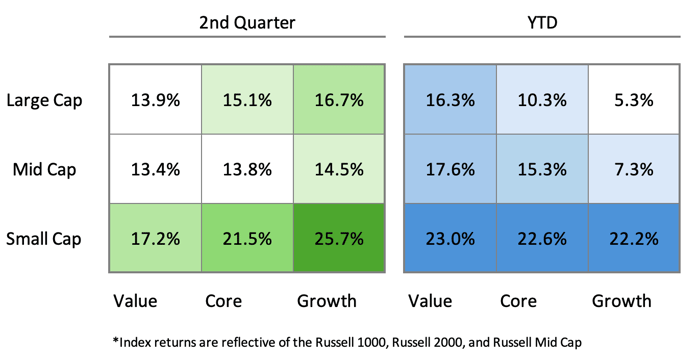
Within style, value remained an important part of the broadening story, particularly further down the capitalization spectrum. Smaller value-oriented companies benefited from two forces: improving earnings trends and renewed investor interest outside the largest growth leaders. The Russell 2000 Value Index was one of the stronger major subindexes through the first half, supported by earnings growth of more than 40%, suggesting that investors were increasingly rewarding companies with improving fundamentals outside the mega-cap growth complex. This does not mean the market fully rotated away from growth, as Technology and AI-linked earnings remained important sources of support. Rather, the quarter showed a more balanced style backdrop, with large-cap growth still contributing meaningfully while smaller-cap and value-oriented areas began to participate more forcefully.
Size and Style Boxes:
Index returns are reflective of the Russell 1000, Russell 2000, and Russell Mid Cap
Source: Morningstar.1
Despite the strength of the rebound, market breadth remained an important part of the second-quarter story. S&P Dow Jones Indices noted that Technology stocks accounted for much of the S&P 500’s first-half performance, but also that nearly 45% of S&P 500 constituents outperformed through the first half, suggesting a more constructive environment for stock selection beneath the headline index return. This was reinforced by the dispersion backdrop, where realized dispersion across U.S. equities remained historically elevated even as realized volatility moderated late in the quarter. In other words, stocks were not moving together in a single broad trend. The gap between winners and laggards remained wide, reinforcing the importance of looking beneath index-level returns to understand where market leadership was actually forming.
Taken together, the second quarter showed a healthier equity backdrop than the headline concentration story alone would suggest, but it also reinforced how dependent investor sentiment remains on a narrow set of themes. Small caps, value-oriented areas, equal weight, and select non-mega-cap segments all showed signs of improving participation, while elevated dispersion suggested that company-level fundamentals continued to matter. At the same time, the sharp reversal in bitcoin highlighted a broader shift in speculative appetite. Bitcoin fell sharply during the quarter as a more hawkish Fed backdrop, weaker crypto fund flows, and renewed investor focus on AI-linked equities weighed on demand. The move served as a reminder that leadership can rotate quickly when liquidity, policy expectations, and investor enthusiasm shift, particularly in areas where valuations are more dependent on momentum and risk appetite.
Bitcoin Sees Nearly 40% Drawdown From Recent Peak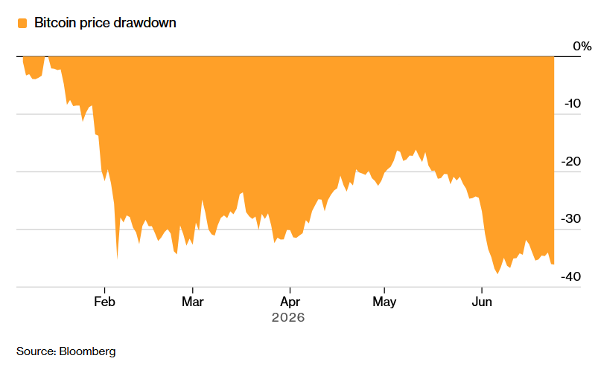
Source: Bloomberg
Fixed Income - Modest Returns, Hawkish Repricing
Fixed income markets posted modest gains in the second quarter, but the backdrop remained challenging as investors reassessed the path of monetary policy. The Bloomberg U.S. Aggregate Bond Index gained 0.7% in Q2 and 0.6% year to date, reflecting a more stable quarter after the rate volatility seen earlier in the year. Shorter-duration areas continued to benefit from elevated yields, with Treasury bills and floating-rate Treasuries both posting positive returns, while longer-duration Treasuries also recovered modestly during the quarter. Credit-sensitive sectors performed better, with investment-grade corporates gaining 1.4% in Q2, high yield rising 2.5%, and municipal bonds gaining 2.5%.
One notable outlier within fixed income was convertible bonds, which benefited from the sharp rebound in equities and renewed strength in growth-oriented market leadership. The Bloomberg U.S. Convertible Composite Index gained 18.5% in Q2, bringing its year-to-date return to 22.1%, far outpacing traditional core fixed income. The move reflected the hybrid nature of convertibles, which can participate in equity upside while still retaining bond-like characteristics. In the second quarter, that equity sensitivity was particularly valuable as Technology, AI-linked companies, and higher-beta segments of the market rallied. The asset class also benefited from strong technical support, as companies increasingly used the convertible market to fund AI-related capital spending and growth initiatives. U.S. convertible issuance reached roughly $34 billion in the first four months of 2026, more than double the same period a year earlier. Another report showed $85.5 billion of issuance across 127 deals by early June, underscoring the connection between the AI investment cycle and equity-linked credit markets.
Fixed Income Returns: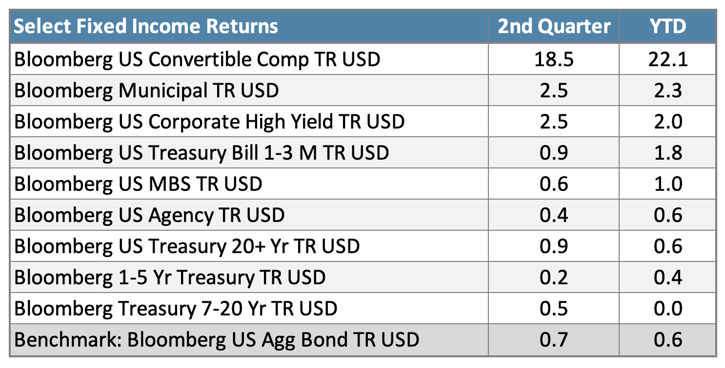
Source: Morningstar.1
The Federal Reserve remained the central focus for bond markets, particularly after the June meeting reinforced a more inflation-sensitive policy stance under Chair Kevin Warsh. Markets entered the year expecting a more supportive rate-cutting cycle, but persistent inflation pressure, resilient economic data, and the energy shock from the Iran conflict pushed expectations in the opposite direction. After the June meeting, investors moved to price a higher probability of rate hikes later in 2026, while the front end of the Treasury curve reacted sharply to the possibility that inflation had not been fully contained. This left fixed income in a more balanced but less comfortable position: starting yields continued to offer income support, but rate sensitivity remained elevated as markets adjusted to a higher-for-longer policy path.
International Markets - Broad Gains, Diverging Regional Paths
International equities also participated in the second-quarter rebound, with several non-U.S. markets continuing to outpace U.S. equities through the first half. The MSCI ACWI ex USA Index gained 14.5% in Q2 and 13.7% year to date, while the MSCI EAFE Index rose 10.8% in the quarter and 9.4% year to date. Emerging markets were especially strong, with the MSCI EM Index advancing 24.1% in Q2 and 23.8% year to date, supported by strength across parts of Asia and continued investor interest in markets tied to technology supply chains and improving global risk appetite. The rebound marked a sharp contrast from the first quarter, when international equities came under pressure from the Middle East conflict, higher energy prices, and renewed inflation concerns.
International Returns: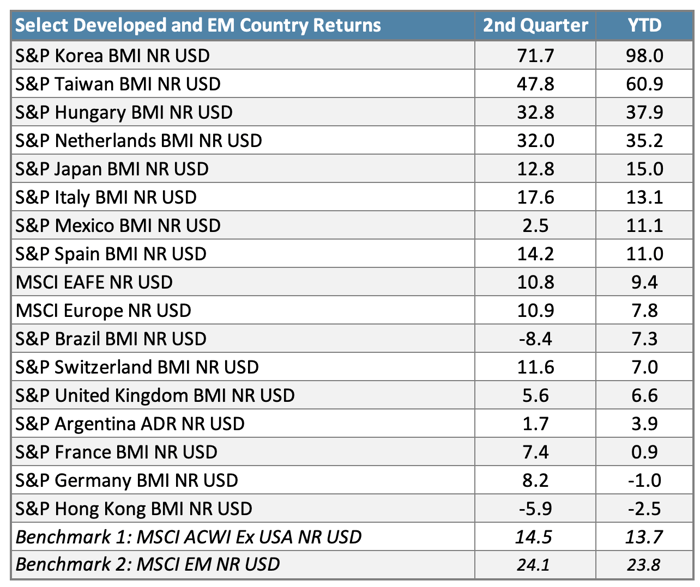
Source: Morningstar.1
Regional performance, however, remained highly differentiated. Europe posted solid gains in the second quarter, with MSCI Europe rising 10.9%, though the region still faced a more complicated macro backdrop as energy prices, fiscal pressure, and renewed inflation risks weighed on the policy outlook. The ECB raised rates in June, its first hike in nearly three years, and warned that inflation pressures tied to the energy shock were beginning to broaden beyond energy alone. The Bank of England also remained cautious, as policymakers continued to balance sticky inflation against slower growth. This left European markets supported by improving earnings and valuation interest, but still sensitive to rate volatility, currency moves, and the path of energy prices.
Within emerging markets, performance varied widely beneath the surface. The MSCI EM Index gained 24.1% in Q2 and 23.8% year to date, led by strength in Asia, where the MSCI EM Asia Index rose 30.2% in the quarter and 28.2% year to date. Much of that strength reflected renewed demand for markets tied to the technology and semiconductor supply chain, particularly as the AI investment cycle continued to support investor appetite for select Asian exporters. By contrast, China remained a notable laggard, with the MSCI China Index falling 6.6% in Q2 and 15.0% year to date, as weaker consumer spending, property-market pressure, and softer investment activity continued to weigh on sentiment. The divergence reinforced a key theme across emerging markets: regional exposure mattered, with technology-linked markets benefiting from the global growth rally while China continued to face more domestically driven headwinds.
Taken together, international markets continued to offer a more varied return profile than the headline index numbers suggest. Developed markets benefited from the broader recovery in risk assets, but Europe remained sensitive to energy prices, inflation pressure, and central-bank policy. Emerging markets were stronger overall, though performance was highly dependent on regional exposure, with technology-linked Asia leading while China lagged. As in the U.S., the quarter reinforced the importance of looking beneath broad benchmarks, as country, currency, sector, and policy differences continued to drive meaningful dispersion across non-U.S. markets.
Navigating Dispersion with Patience
The second quarter highlighted how quickly markets can recover when earnings remain resilient and investor sentiment improves. After a difficult start to the year, equities rebounded sharply, credit-sensitive fixed income performed better than core bonds, and international markets participated in the broader recovery. At the same time, the quarter also showed that the recovery was not uniform. Leadership remained concentrated in AI-linked areas of the market, policy expectations shifted in a more hawkish direction, and dispersion across sectors, styles, regions, and asset classes remained elevated.
That backdrop reinforces the importance of patience and diversification. Markets have continued to climb a wall of worry, but the drivers of return have shifted meaningfully from quarter to quarter, from energy and inflation hedges in Q1 to technology, convertibles, small caps, and emerging-market Asia in Q2. These rotations are difficult to predict in advance and can happen quickly as policy expectations, earnings trends, and investor sentiment evolve.
Looking ahead, the key question is whether market leadership can continue to broaden beyond the areas that have already delivered the strongest gains. Earnings growth remains supportive, but higher rates, inflation uncertainty, geopolitical risk, and elevated expectations around AI-related spending leave room for volatility. In this environment, maintaining a disciplined, diversified approach remains important, particularly as markets continue to reward selectivity and as opportunities emerge beneath the surface of headline index returns.
NOTE:
GeoWealth's Market Commentary has converted from a monthly cadence to a quarterly cadence. This change allows us to provide deeper insights into market trends and developments. Click here to browse prior Market Commentaries.
Sources:
- Data from Morningstar. Returns over one year are annualized.
DISCLOSURES:
This content is intended for investment professionals. Past performance is no guarantee of future returns.
For Advisor Use only.
This material is provided for informational and educational purposes only and does not constitute investment advice, a solicitation, or an offer to buy or sell any security. The content is developed from sources believed to be reliable and is presented in good faith; however, we do not guarantee its accuracy or completeness, and it should not be regarded as a complete analysis of the subjects discussed. This information is not intended to provide, and should not be relied upon for, investment, legal, or tax advice.
Indexes referenced herein are unmanaged, do not reflect fees or transaction costs, and cannot be invested in directly. Index and benchmark performance is shown for illustrative purposes only.
All investments involve risk, including the possible loss of principal. No investment strategy can guarantee a profit or protect against loss. Past performance is not indicative of future results.
The graphs and charts in this commentary are for illustrative purposes only and not indicative of any actual investment. Index returns do not reflect any fees, expenses, or sales charges. Stocks are not guaranteed and have been more volatile than other asset classes. Historical returns were the result of certain market factors and events which may not be repeated in the future. Financial professionals are responsible for evaluating investment risks independently and for exercising independent judgement in determining whether investments are appropriate for clients.
The information here is not intended to constitute an investment recommendation or advice. GeoWealth is an Investment Adviser registered with the U.S. Securities and Exchange Commission (SEC). Registration with the SEC does not imply a certain level of skill or training.
Indices do not include fees or operating expenses and are not available for actual investment. Also, since the trades have not actually been executed, the results may have under- or overcompensated for the impact of certain market factors such as lack of liquidity. Simulated trading programs in general are also subject to the fact that they are designed with the benefit of hindsight. Returns will fluctuate and an investment upon redemption may be worth more or less than its original value. Past performance is not indicative of future returns. An individual cannot invest directly in an index.
This material has been prepared for information and educational purposes and should not be construed as a solicitation for the purchase or sell of any investment. The content is developed from sources believed to be reliable. This information is not intended to be investment, legal or tax advice. Investing involves risk, including the loss of principal. No investment strategy can guarantee a profit or protect against loss in a period of declining values.