
GeoWealth's Market Observations
INSIGHTS FROM OUR INVESTMENT SOLUTIONS TEAM
Q4 2025's Key Themes:
December 31, 2025-
Global markets closed 2025 with strong absolute returns but a clear shift in leadership. While U.S. equities delivered solid mid-to-high-teens gains, international equities materially outperformed, marking the widest gap versus U.S. markets in over a decade and reinforcing the benefits of global diversification after a prolonged period of U.S. dominance.
-
Market leadership broadened beneath the surface, even as headline indices masked dispersion. Factor, sector, and regional outcomes varied widely in Q4, with defensive areas such as Health Care outperforming late in the year, commodities and precious metals posting exceptional full-year gains, and pockets of speculative risk unwinding sharply, highlighting a more selective and less uniform market environment.
-
Fixed income reasserted its role as a source of income and stability amid shifting policy expectations. Despite a late-year Federal Reserve rate cut accompanied by a more cautious forward path, core bonds delivered steady returns in 2025, supported by attractive starting yields and resilient credit fundamentals.
Market Total Returns as of 12/31/25: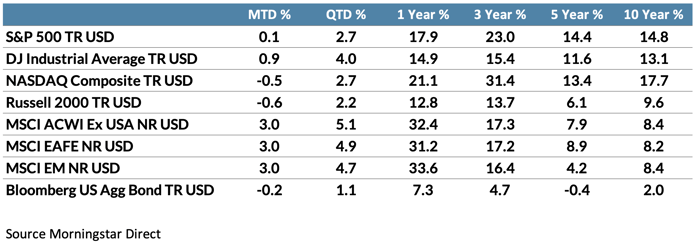
Source: Morningstar.1
U.S. Equities – Returns Hold Firm as Selectivity Increases
U.S. equities ended the fourth quarter modestly higher, closing out a strong year at the index level. The S&P 500 Total Return Index gained 2.7% in Q4 and 17.9% for the full year, though breadth declined slightly for the year as 304 constituents gained vs 332 in 2024. This growing gap between index-level performance and individual stock outcomes underscored a market increasingly defined by dispersion rather than broad participation.
S&P 500 Sector Returns: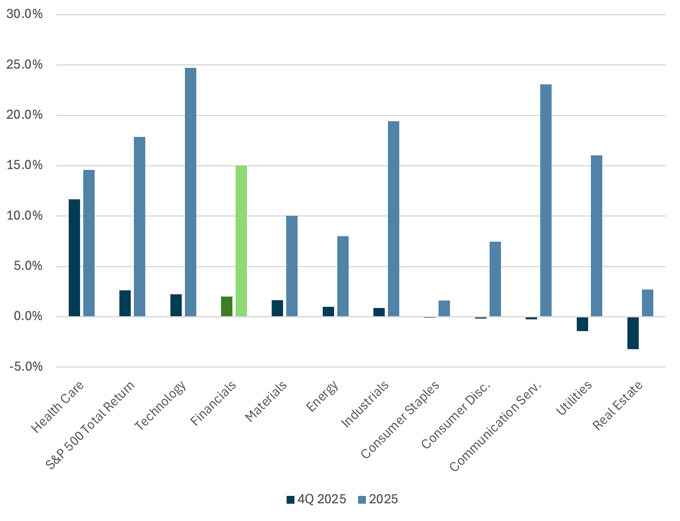
Source: Morningstar.1
Sector leadership rotated late in the year, reinforcing this trend. Health Care rose 11.7% in Q4, while Real Estate declined 3.2%. Technology remained a top contributor for the year, finishing up 24.7%, though leadership narrowed meaningfully as investors became more selective. That selectivity aligned closely with forward earnings expectations. According to FactSet Earnings Insight (December 2025), five sectors are projected to deliver double-digit earnings growth in 2026: Technology, Materials, Industrials, Communication Services, and Consumer Discretionary. In contrast, Real Estate not only lagged in 2025, posting low-single-digit returns, but also carries the lowest projected earnings growth among S&P 500 sectors, underscoring how sector-level fundamentals increasingly drive dispersion beneath headline index performance.
S&P 500 Earnings Growth: CY 2026
(Source: FactSet)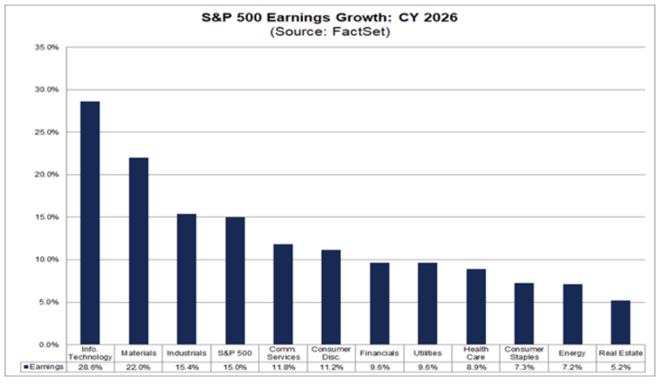
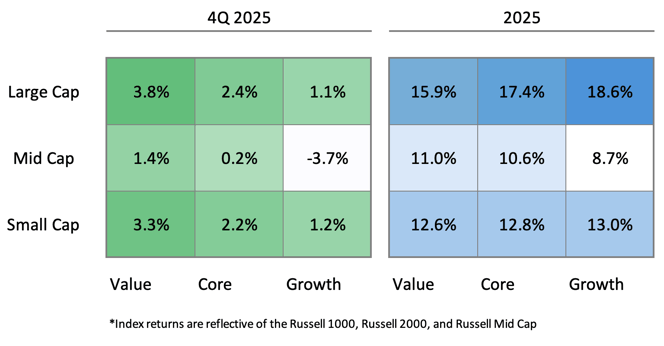
Style and size dynamics reflected similar crosscurrents. Growth outperformed value for the full year, with the Russell 1000 Growth returning 18.6% versus 15.9% for value. However, relative performance shifted in Q4 as value held up better and smaller-cap stocks posted intermittent strength, suggesting sensitivity to evolving expectations around financial conditions and earnings durability.
Size and Style Boxes:
Index returns are reflective of the Russell 1000, Russell 2000, and Russell Mid Cap
Source: Morningstar.1
By year-end, factor and stock-level dispersion became a defining feature of U.S. equity markets. Higher-risk factors materially outperformed in 2025, with the S&P 500 High Beta Index up 33.2% and the S&P 500 Momentum Index up 26.9%, while more defensive exposures lagged, with the S&P 500 Low Volatility Index returning just 4.4% for the year. At the same time, valuation discipline increased late in the year, as stocks missing earnings expectations were penalized more sharply than earlier in the cycle. Together, these dynamics point to a market environment that remains constructive at the index level but increasingly selective beneath the surface.
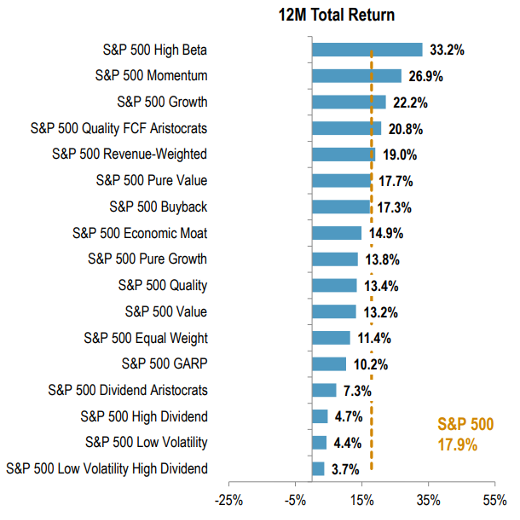
Source: S&P Dow Jones Indices
Fixed Income - Income Holds as Policy Uncertainty Persists
Fixed income markets closed 2025 on firmer footing, supported by attractive starting yields and a clearer, if still cautious, policy backdrop. In December, the Federal Reserve delivered a rate cut, but accompanying guidance struck a more restrained tone, as the updated dot plot projected only one additional cut in 2026 and revealed notable internal disagreement among policymakers. This “hawkish cut” framing reinforced the view that policy normalization would proceed gradually, with financial conditions already doing much of the easing work. As a result, bond markets treated the decision as confirmation rather than a catalyst, supporting steady income-driven returns across core fixed income into year-end.
The Fed's December Dot Plot:
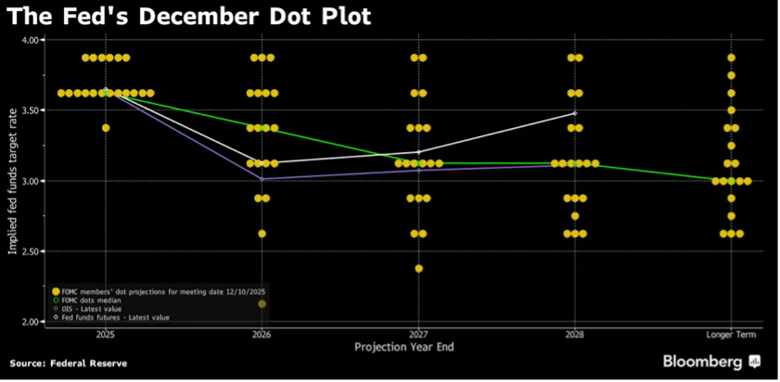
Source: Bloomberg
The December rate cut lowered the federal funds target range to 3.50%–3.75%, but the Fed’s median dot plot continued to signal only one additional cut in 2026, underscoring a persistent gap between policymaker expectations and market-implied rate paths. That divergence contributed to continued yield-curve volatility, particularly in intermediate maturities most sensitive to shifting policy expectations.
Beneath the policy backdrop, fixed-income performance in 2025 showed meaningful differentiation across duration and sector exposures. Core bonds delivered steady returns, with the Bloomberg U.S. Aggregate Bond Index up 7.3% for the year. Intermediate Treasuries outperformed longer maturities as shifting rate expectations limited gains at the long end. PIMCO noted that strategies with intentional, selective duration exposure were rewarded when aligned with curve positioning rather than outright rate calls, particularly in the intermediate portion of the curve. At the same time, spread sectors contributed meaningfully to returns, with investment-grade corporates returning 7.8% and high yield 8.6% in 2025, supported by resilient fundamentals and contained default expectations.
Fixed Income Returns: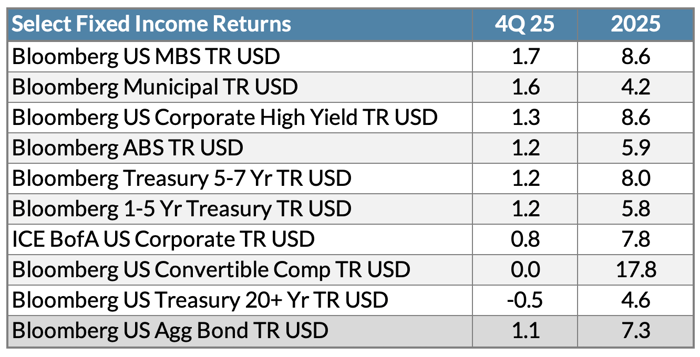
Source: Morningstar.1
The primary driver of fixed income returns in this phase has been income generation through carry and sector selection, rather than duration-led price appreciation. With policy rates still elevated, yields across core fixed income entered 2025 at levels not seen in over a decade, allowing investors to earn mid-single-digit returns even in the absence of meaningful rate declines. This dynamic was evident in the relatively stable performance of credit sectors, where investment-grade and high-yield bonds generated returns largely through income rather than spread compression, despite ongoing policy uncertainty. Together, these outcomes underscore a fixed-income environment shaped more by structural yield dynamics than by directional moves in interest rates, with income accruals and sector-level dispersion driving results more than shifts in policy expectations.
International Markets - Strong Returns Beyond the U.S as Divergence Emerges
International markets delivered strong returns in 2025, materially outperforming U.S. equities as leadership broadened beyond a narrow set of domestic drivers. The MSCI ACWI ex USA Index returned 32.4% for the year, compared with 17.9% for the S&P 500, marking the widest performance gap in favor of international equities in more than a decade. Developed Europe was a key contributor, with the MSCI Europe Index gaining 35.4%, supported by easing inflation trends, improving earnings momentum, and a market composition more tilted toward financials, industrials, and value-oriented sectors that benefited from stabilizing growth conditions. This broad-based strength reflected a notable shift in global equity leadership following an extended period of U.S. outperformance.
International Returns: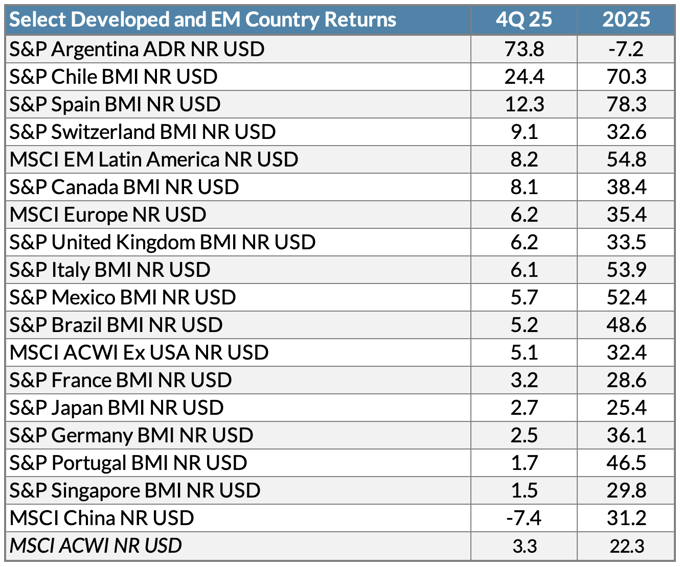
Source: Morningstar.1
Emerging markets and regional dynamics further shaped the global equity landscape. While much of the world outpaced the U.S., China’s equity rally showed signs of uneven momentum late in 2025, with key gauges such as the Hang Seng and MSCI China indices approaching technical correction levels amid weak economic data and fading growth optimism. That pullback occurred even though the MSCI China Index still posted a strong annual gain of 31.2% through year-end, reflecting earlier optimism around innovation and policy support. By contrast, Latin America was among the standout emerging regions, with several markets logging robust gains as commodity prices, political shifts, and improving macro conditions supported equity markets and investor interest. These regional differences highlighted that, while global equities broadly outperformed, drivers varied materially by market: China’s momentum was tempered by structural woes, while Latin America was buoyed by cyclical and commodity factors.
Beneath the equity performance, divergent central bank paths increasingly shaped international market outcomes. In Europe, the European Central Bank moved toward a more accommodative stance as inflation pressures eased and growth remained subdued, supporting both equity and rate-sensitive segments of the market. In Asia, policy divergence was even more pronounced: the Bank of Japan maintained accommodative settings amid evolving domestic inflation dynamics, while the Bank of Korea remained more cautious given household leverage and financial stability concerns. These differences translated directly into currency movements, with the yen remaining a key source of volatility and the euro exhibiting greater stability as policy expectations converged. At the same time, capital flows increasingly favored regions offering a combination of improving growth momentum and more attractive valuations, particularly across parts of Europe and Latin America, where equity markets entered the year at meaningful discounts to U.S. peers. Together, these dynamics reinforced that international market performance in 2025 was driven not by a single global macro narrative, but by region-specific policy choices, currency effects, and relative valuation resets.
Navigating Dispersion: Shifting Leadership Across Markets
As 2025 came to a close, markets delivered strong headline returns across asset classes, but the underlying drivers grew increasingly differentiated. U.S. equities advanced at the index level despite narrowing breadth, fixed income returns were anchored by income rather than price appreciation, and international markets benefited from divergent policy paths and valuation resets. Across regions and asset classes, dispersion rather than direction increasingly shaped outcomes.
Looking ahead, this backdrop reinforces a market environment where results are less likely to be driven by a single macro catalyst and more by regional dynamics, earnings delivery, and structural differences across asset classes. In that context, market leadership may continue to shift, favoring areas where fundamentals, policy, and valuations align rather than broad-based participation.
NOTE:
GeoWealth's Market Commentary has converted from a monthly cadence to a quarterly cadence. This change allows us to provide deeper insights into market trends and developments. Click here to browse prior Market Commentaries.
Sources:
- Data from Morningstar. Returns over one year are annualized.
DISCLOSURES:
Past performance is no guarantee of future returns.
The graphs and charts in this commentary are for illustrative purposes only and not indicative of any actual investment. Index returns do not reflect any fees, expenses, or sales charges. Stocks are not guaranteed and have been more volatile than other asset classes. Historical returns were the result of certain market factors and events which may not be repeated in the future. Financial professionals are responsible for evaluating investment risks independently and for exercising independent judgement in determining whether investments are appropriate for clients.
The information here is not intended to constitute an investment recommendation or advice.
Returns are based on the S&P 500 Total Return Index, an unmanaged, capitalization-weighted index that measures the performance of 500 large capitalization domestic stocks representing all major industries. Indices do not include fees or operating expenses and are not available for actual investment. The hypothetical performance calculations are shown for illustrative purposes only and are not meant to be representative of actual results while investing over the time periods shown. The hypothetical performance calculations for the respective strategies are shown gross of fees. If fees were included returns would be lower. Hypothetical performance returns reflect the reinvestment of all dividends. The hypothetical performance results have certain inherent limitations. Unlike an actual performance record, they do not reflect actual trading, liquidity constraints, fees and other costs. Also, since the trades have not actually been executed, the results may have under- or overcompensated for the impact of certain market factors such as lack of liquidity. Simulated trading programs in general are also subject to the fact that they are designed with the benefit of hindsight. Returns will fluctuate and an investment upon redemption may be worth more or less than its original value. Past performance is not indicative of future returns. An individual cannot invest directly in an index.
This material has been prepared for information and educational purposes and should not be construed as a solicitation for the purchase or sell of any investment. The content is developed from sources believed to be reliable. This information is not intended to be investment, legal or tax advice. Investing involves risk, including the loss of principal. No investment strategy can guarantee a profit or protect against loss in a period of declining values.